Traffic Sign Classifier
TensorFlow, Python, Jupyter
Goals
The goals / steps of this project are the following:
- Load the data set (see below for links to the project data set)
- Explore, summarize and visualize the data set
- Design, train and test a model architecture
- Use the model to make predictions on new images
- Analyze the softmax probabilities of the new images
- Summarize the results with a written report
Data Set Summary & Exploration
I used numpy and python to calculate summary statistics of the traffic signs dataset and seaborn to visualize:
- The size of training set is 34799
- The size of test set is 12630
- The shape of a traffic sign image is (32, 32, 3)
- The number of unique classes/labels in the data set is 43
Here is an exploratory visualization of the data set. It is a bar chart showing how the data distributed over 43 classes.

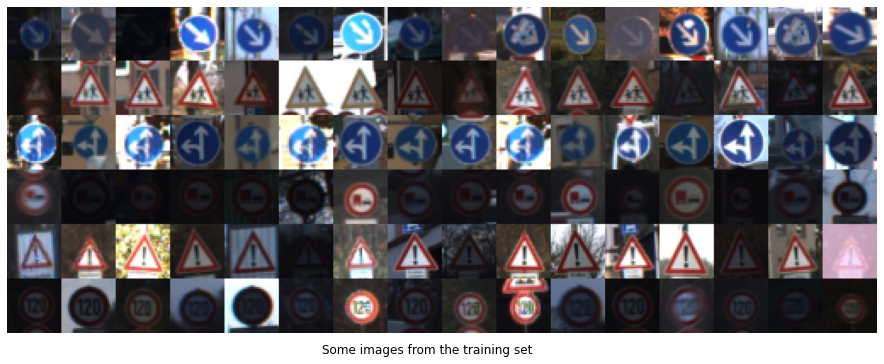
Below is the example of how the dataset looks like.

Design and Test a Model Architecture
As a first step, I decided to normalize the image to improve the accuracy and it gives me a positive result. Because some of the data are limited compared to the others, I decided to generate additional data. This can improve make the model more robust because it has more data to learn.
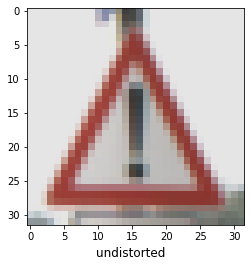
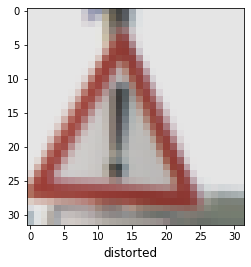
To add more data to the the data set, I applied some small distortion effect to the dataset.
Here is an example of an original image and an augmented image:


After I generated this augmented data, the dataset becomes much bigger.
Model
My final model consisted of the following layers:
| Layer | Description |
|---|---|
| Input | 32x32x3 RGB image |
| Convolution 5x5 | 1x1 stride, valid padding, outputs 28x28x32 |
| RELU | |
| Max pooling | 2x2 stride, outputs 14x14x32 |
| Convolution 5x5 | 1x1 stride, valid padding, outputs 10x10x32 |
| RELU | |
| Max pooling | 2x2 stride, outputs 5x5x32 |
| Droprout | 2x2 stride, outputs 14x14x32 |
| Max pooling | keep_prob = 0.5 |
| Fully connected | Input 1600, outputs 120 |
| RELU | |
| Max pooling | 2x2 stride, outputs 14x14x32 |
| RELU | |
| Droprout | keep_prob = 0.5 |
| Fully connected | Input 120, outputs 84 |
| RELU | |
| Droprout | keep_prob = 0.5 |
| Fully connected | Input 84, outputs 43 |
To train the model, I used AdamOptimizer, a batch size of 128, 20 epochs, a learn rate of 0.001. Lastly, I used 0.5 of dropout rate for training to achieve highest validation accuracy.
Result
My final model results were:
- training set accuracy of 0.997
- validation set accuracy of 0.983
- test set accuracy of 0.972
I started with original LeNet architecture as it has been provided from the previous lecture. I managed to achieve around 0.893 validation accuracy. However, it is not good enough. I added the depth and also more layer to extract more features. I know this may result in overfitting, that is why I put dropout operations between the fully connected layers. Surprisingly, the result was very good on the validation and test data.
Test a Model on New Images
Here are eight German traffic signs that I found on the web that are completely not inside the training sets:

The difficulty from these images is that they have different size. I programmed to resize them to be 32x32 pixels so that it will fit to the model. On top of that, the third image is a bit darker compared to the others.
Here are the results of the prediction:
| Image | Prediction |
|---|---|
| Speed limit (30km/h) | Speed limit (30km/h) |
| Right-of-way at the next intersection | Right-of-way at the next intersection |
| Priority road | Priority road |
| Vehicles over 3.5 metric tons prohibited | Vehicles over 3.5 metric tons prohibited |
| General caution | General caution |
| Turn right ahead | Turn right ahead |
| Keep right | Keep right |
The model was able to correctly guess 8 of the 8 traffic signs, which gives an accuracy of 100%. This compares favorably to the accuracy on the test set of 97.2%
Below is the probablity after I used softmax.
The first image
- Speed limit (30km/h): 1.00000
- Speed limit (20km/h): 0.00000
- Speed limit (50km/h): 0.00000
- General caution: 0.00000
- Speed limit (80km/h): 0.00000
The second image
- Right-of-way at the next intersection: 1.00000
- Beware of ice/snow: 0.00000
- Double curve: 0.00000
- Pedestrians: 0.00000
- End of no passing by vehicles over 3.5 metric tons: 0.00000
The third image
- Priority road: 1.00000
- End of all speed and passing limits: 0.00000
- Yield: 0.00000
- Keep right: 0.00000
- End of no passing: 0.00000
The fourth image
- Vehicles over 3.5 metric tons prohibited: 1.00000
- No passing: 0.00000
- Speed limit (100km/h): 0.00000
- End of no passing by vehicles over 3.5 metric tons: 0.00000
- Speed limit (60km/h): 0.00000
The fifth image
- General caution: 1.00000
- Traffic signals: 0.00000
- Pedestrians: 0.00000
- Road narrows on the right: 0.00000
- Road work: 0.00000
The sixth image
- Turn right ahead: 1.00000
- Ahead only: 0.00000
- Go straight or right: 0.00000
- Go straight or left: 0.00000
- Turn left ahead: 0.00000
The seventh image
- Keep right: 1.00000
- Turn left ahead: 0.00000
- Roundabout mandatory: 0.00000
- Speed limit (50km/h): 0.00000
- Speed limit (20km/h): 0.00000
The eighth image
- Keep right: 1.00000
- Turn left ahead: 0.00000
- Roundabout mandatory: 0.00000
- Speed limit (50km/h): 0.00000
- Speed limit (20km/h): 0.00000